MSIS Tableau Series: Storytellers and Data-Based Decision Makers
A blend of storytelling and data science runs through the MSIS program. Throughout the program, students learn about the tools and techniques needed to not only interpret and analyze data, but tell its story. One such technique is mastering live visual analytics tools and one of the most in-demand skills in the data analytics ecosystem is Tableau.
Tableau – Live Visual Analytics
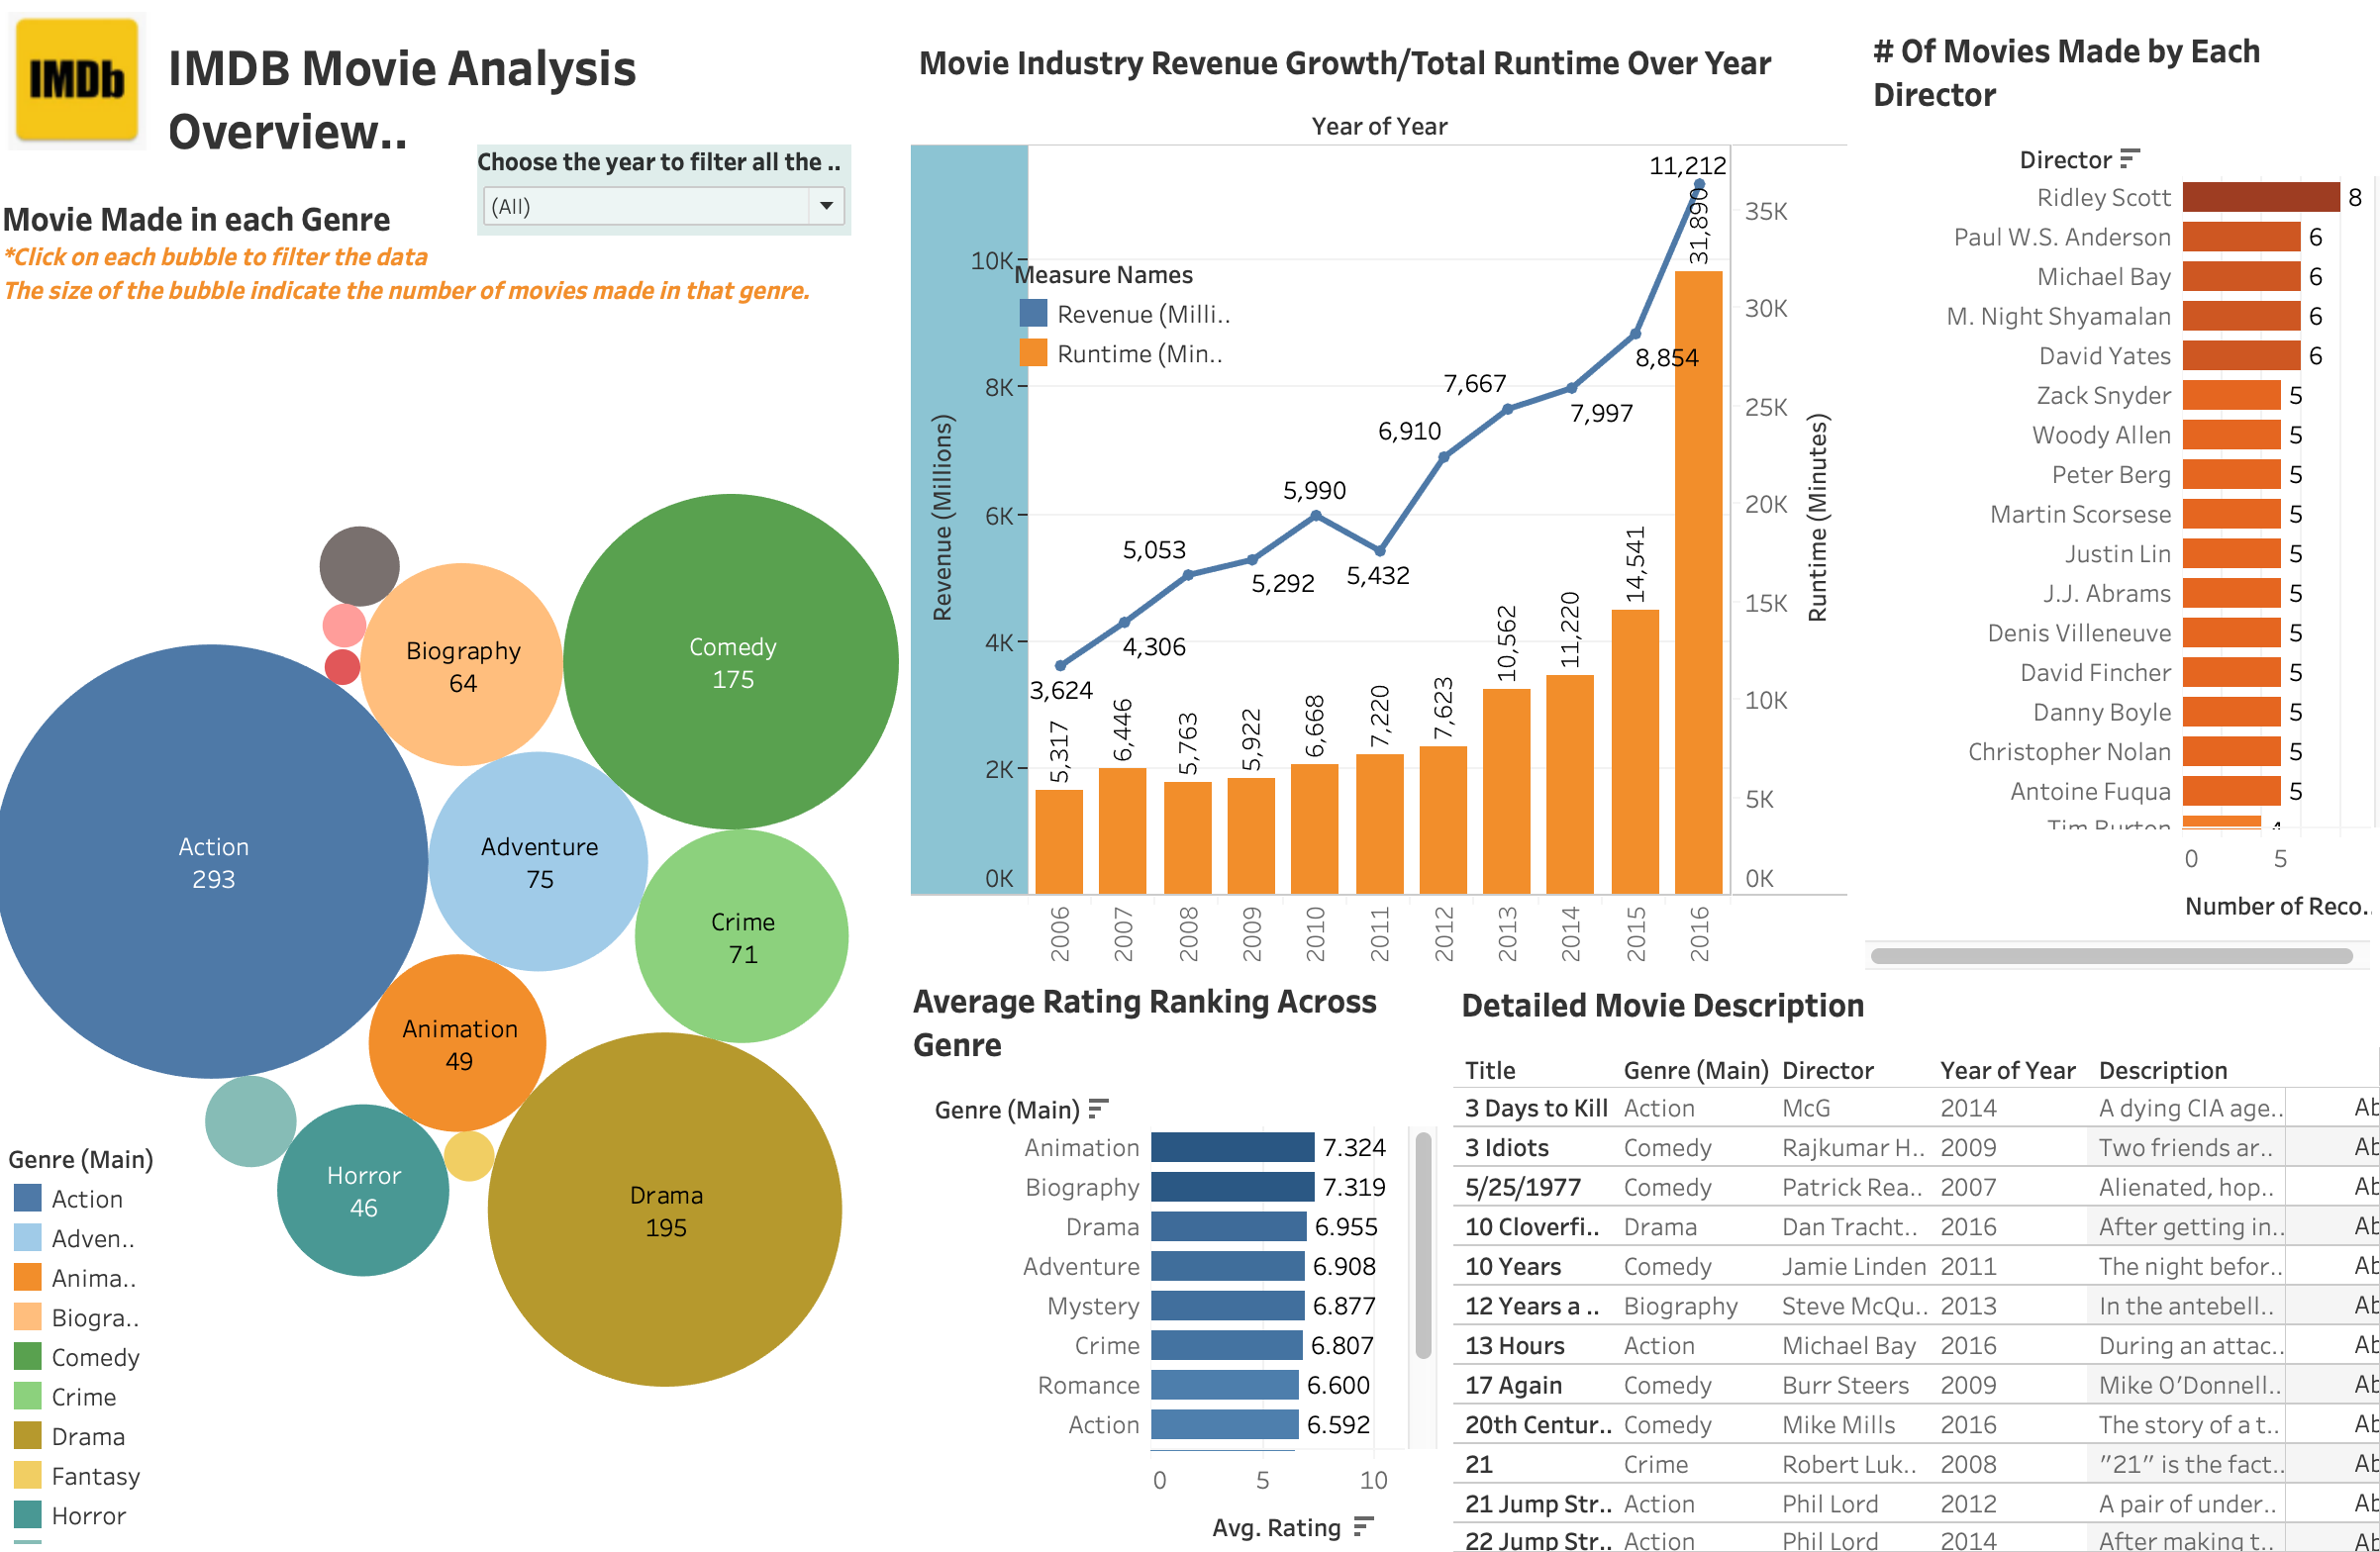
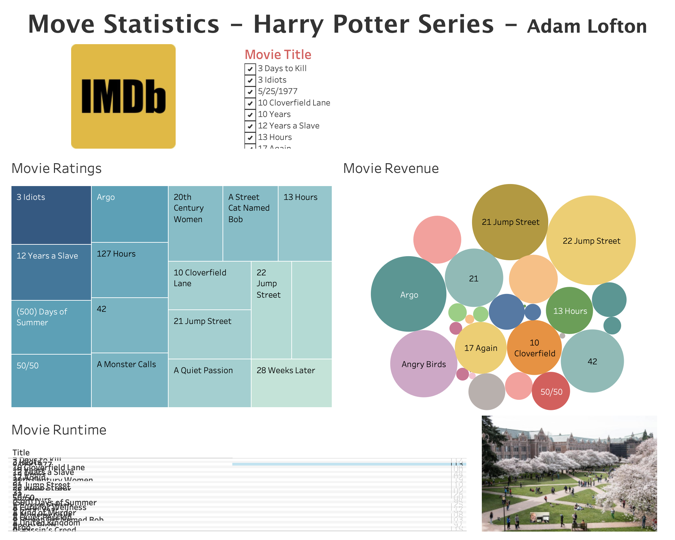
Using big data, a SQL database, a spreadsheet, or a variety of cloud apps, users can create dynamic and creative visual dashboards to analyze volumes of data. This powerful research tool allows users to ask complicated questions, spot trends, create evidenced-based analysis, and tell business stories based on data science.
In addition to its core curriculum, the MSIS program has added a new four-part Tableau series taught by Tableau Trainer, Michael Shan.
The first series was launched in June 2019 and the workshop is held once per quarter. The workshops have been designed and scheduled to complement student’s current course load and the topics covered ranged from learning about different chart types and visual elements to performing analytics via calculation.

“MSIS students come to the program with sharp analytical skills. The Tableau program exposes them to a new world of data-based decision making. We work with the program’s fundamental tools and work through more advanced intermediate skills. That’s when data analysis becomes interesting.”
Natasha Karmali, MSIS Class of 2020, said, “I enjoyed the hands-on walk through of the most important features in Tableau. Learning a new piece of software can be intimidating, but the workshops helped us focus on key capabilities of the tool and how to implement them in a real-world setting.”
Interactive Online Learning
The final Tableau workshop was successfully adapted to an all online platform and provided students with an in-demand technical resume building skill. The conclusion of the series taught students about data connections and how to apply the skills from past workshops to build an interactive Tableau dashboard.
I have a better sense of how the analysis/visualization could be applied to solve real problems and what are some important metrics to look at. At work, I need to define these metrics, and the questions from the workshop provides me with good inspiration.”
-Amber Jiang, Procurement Analyst, Boeing

Michael Shan’s enthusiasm for Tableau training shined in this online format, where he shared his advice for students when creating these dashboards. Shan believes you must always start with a purpose, understand your audience, and sketch out your plan. Follow these three tips and you’ll find success.

While the workshop was adapted to an online format, the nature of the software and Michael’s teaching didn’t slow anyone down.” Natasha adds, “Michael kept the course interactive by using the features in Zoom like Raise Hand and Q&A. He gave us free time to apply the skills we learned throughout all his sessions to create our own dashboard. It was a wonderful way to wrap up the workshop series and is something tangible I can add to my portfolio.”
 “This online session was delivered exceptionally well. I have taken online classes before, so I have experienced learning online. But for this particular workshop, I felt like I was getting a 1:1 session with Michael. I was able to see the content up close and at my own comfort. Michael did amazing. I think Michael’s personality is what helped keep me engaged and captivated. That, and he has great taste in music!”
As MSIS students prepare to graduate this June, they walk towards their future careers with in-demand skills and data storytelling experience.
Graduates can now show how they are able to deliver data and analysis to non-technical managers and decision makers. “I enjoyed that Tableau lets you creatively express data to your audience using customized dashboards you designed, making it easy for people from various backgrounds to visualize and draw meaningful conclusions from data much faster.”
– Varsha Ghanta, MSIS Class of 2020

Sergio Munoz reflects, “the knowledge and skills to work with products that allow me to analyze and present results is one of the biggest things that will help my career in the future. Specifically, learning how to create a dashboard that allows you to tell a story. I think telling a story instead of presenting is much more engaging.”
The results are as unique as each student and that’s a story everyone will remember.
Learn More About the MSIS Program